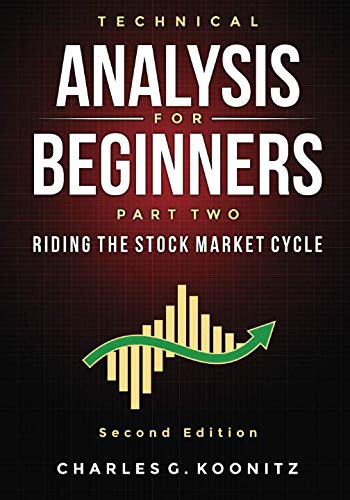
Technical Analysis for Beginners Part Two (Second edition): Riding the Stock Market Cycle

Tripod Solutions inc.Click Buy Now for Updated Price. Estimated Price: $19.95 Free Shipping
*** Second edition. Many improvements have been added to previous version ***
- Improvements for the buy and sell signals on charts
- A glossary of technical analysis terms
- An alphabetical index
- A new layout
First, this book will not cover Elliot Wave.
This book complements the first one Technical Analysis for Beginners Part One – Stop Blindly Following Stock Picks of Wall Street’s Gurus and Learn Technical Analysis.
Any new investor to the financial markets will be eaten by the pros in a short period of time. To protect themselves, investors must rely on technical analysis. By using technical indicators, it’s possible to anticipate trend reversals. But to get there, the use of a charting platform and the understanding of the market cycle stages are essential for the investor.
Anticipation via Technical Tools
This book focuses on the four stages that make up the stock cycle. Being able to detect, before the crowd, the appropriate time to enter an upward stage is the key for any investor. Each stage can be recognized using technical indicators. In fact, everything you know about technical analysis will be used to analyze the market cycle.
Combination of Indicators, Volume, Lines and Patterns
The use of technical indicators remains fairly simple. In this book, the technical indicators are grouped into two categories:
- Leading indicators that launch buying and selling signals.
- Lagging indicators that detect reversals.
The combination of indicators, volume, lines and patterns with the stages of the stock market cycle leads to better control of trading stocks. Understanding each stage is a great way to anticipate the reaction of the markets. The concept of stages raises some issues in a consolidation period. Are indicators are about to launch an imminent breakout signal? Is a sell signal confirmed by other indicators?
Searching for Stocks
It’s not so easy to find the good stocks! The best way consists of using free or inexpensive screening solution. The use of a screening platform allows you to find the rare gems. Sample forms or search filters are available in this book. These filters can be adapted to any screening platform. The logic in creating search filters remains the same, no matter the screening service provider.
Like in the first title, the visual aspect of technical analysis plays an important role. This book contains over 70 figures to help investors in understanding the interaction between the stages of the market cycle and the technical indicators and other patterns. This book does not sell a miracle solution to reap huge profits. The price of a stock is subject to external pressures. Understanding the four stages of the market cycle makes us able to identify when a stock is headed for an upward trend, about to fall, or simply sitting in a consolidation area.
***
ALSO AVAILABLE. In order to reduce printing costs and the selling price, Technical Analysis for Beginners – A Practical Guide for Charting, brings together two previously published books:
- Technical Analysis for Beginners Part One – Stop Blindly Following Stock Picks of Wall Street’s Gurus and Learn Technical Analysis
- Technical Analysis for Beginners Part Two – Riding the Stock Market Cycle

Click Buy Now for Updated Price. Estimated Price: 19.95
Originally posted 2019-11-27 16:35:14. Republished by Blog Post Promoter


